Zabbix and Globalping - Free Global Monitoring
Many companies use services to monitor their website or network from various locations around the world. While these services are nice, it also costs quite a bit of money depending on the interval and measurements. Since we were already using Zabbix for other purposes, I did some research to use it for global (worldwide) monitoring of various systems.
For troubleshooting I have been using Globalping, a service from jsDelivr, for some time now. This allows you to do free global tests such as MTR, Ping, Traceroute and http/https. This gave me the idea to integrate this with Zabbix.
If you're going to use this, don't forget to become a Github sponsor! You can use this method without a Proxy, although I would recommend it. Make sure globalping-cli is installed on the server (or proxy).
Discovery Template
First I created a template that is linked to the Proxy with the name 'Globalping Discovery'. As the name suggests I configured a discovery rule on it. The discovery rule is called 'Globalping World Probes' and executes the following command (using 1.1.1.1 as an example):
system.run[globalping mtr 1.1.1.1 -J -F World -L 5]Make sure the interval is a few hours (3-6). This command executes an MTR from 5 random probes around the world and returns the output in Json. We can then easily parse this via jsonpath.
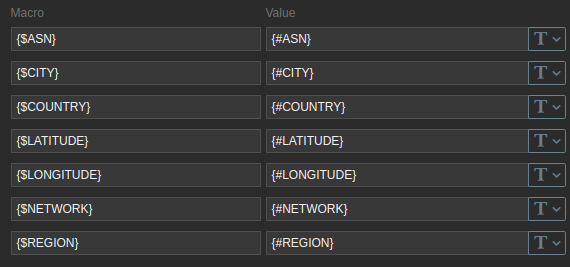
Using the LLD macros we retrieve the relevant data from the probes that were used for this test, like the ASN and the location of the probe:
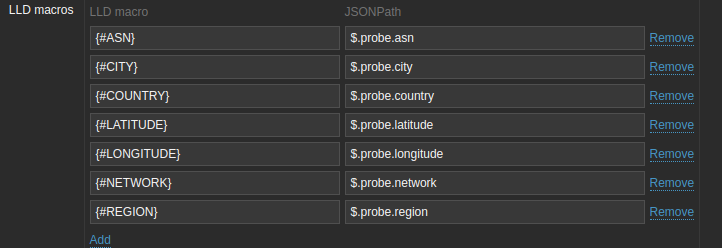
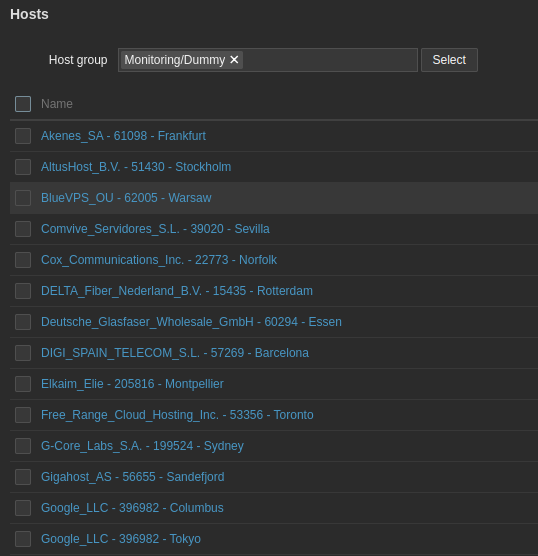
Next, a dummy host needs to be created that repeats the measurements at the correct interval. For this we use the above LLDs.
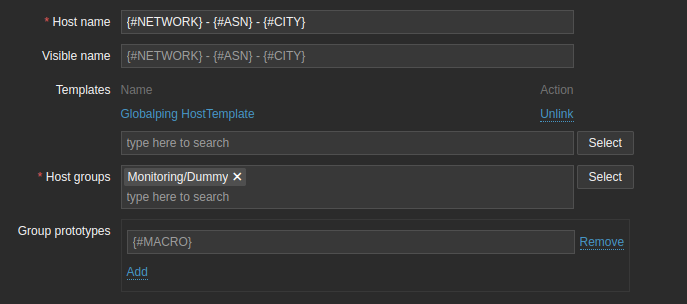
You can see i attach another template to this dummy host, that is the template that will perform the checks from there on. Make sure to copy the Macro's correctly on the host prototype and set the inventory to automatic (important!):
Host Template
Ok so now dummy hosts are created but they do nothing at first. For this I have the Globalping HostTemplate that is linked above to the Host Prototype. Create the template and use two new Zabbix Agent items that execute the following commands:
# Item name: ICMP {$ASN} - {$CITY}
system.run[globalping mtr 1.1.1.1 -J -L 1 -F '{$ASN}+{$CITY}']
# Item name: TCP {$ASN} - {$CITY}
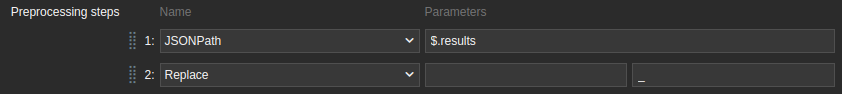
system.run[globalping http 1.1.1.1 -J -F '{$ASN}+{$CITY}' --protocol HTTPS]One item performs an MTR, the other item performs a TCP check on port 443 (https). I've set the interval at around 1 minute, we don't want to abuse the Globalping platform. Again, 1.1.1.1 is an example here. First thing we do is store the probe location in an item, we will use this later for visualization. Create a dependent item, as in the screenshot, where we retrieve the correct value via Jsonpath.
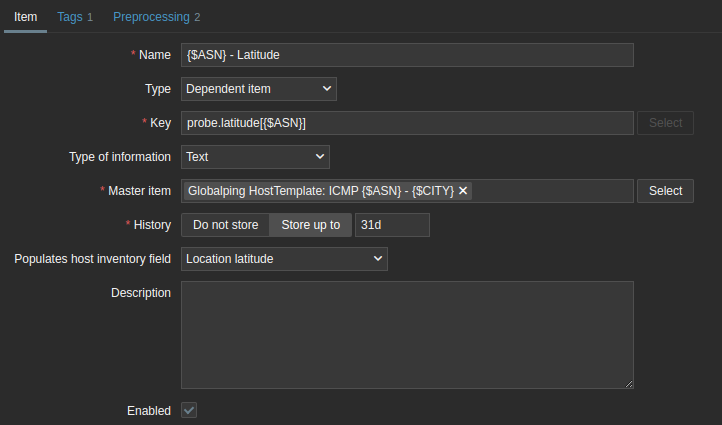
Make sure to set the host inventory field on it and use the following jsonpath:
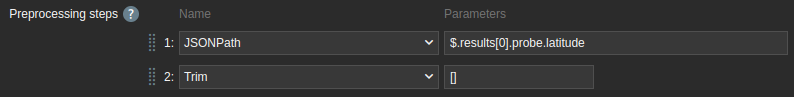
Do the exact same for the Longtitude.
Create new item that stores the total TCP Connect time to the given host. This is great to see if there are performance issues:
Item Name: 1.1.1.1 - Total Time - {$ASN} - {$CITY}, {$REGION}
Type: Dependent item
Item Key: tcp.time.total[{$ASN}]
Units: ms
Master item: TCP {$ASN} - {$CITY}
Now using jsonpath we get the correct metric from the item:
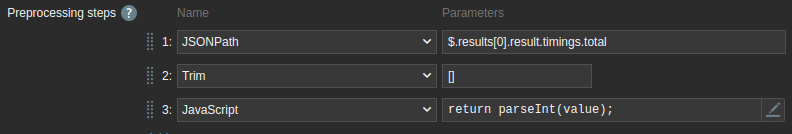
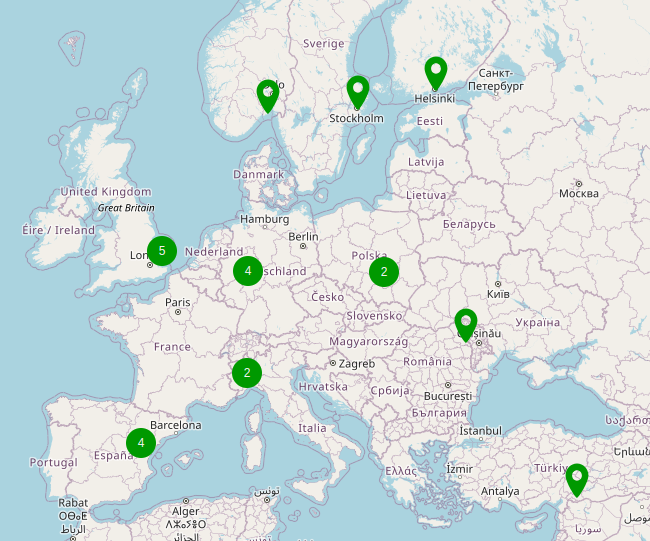
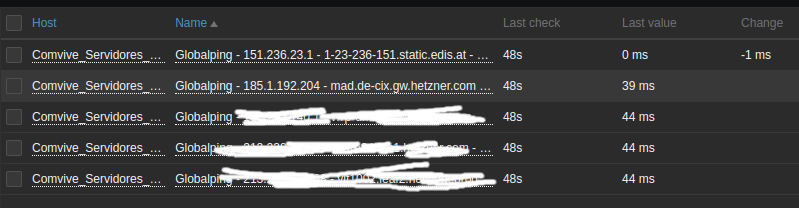
Cool! Because the Discovery on the previous template takes random probes from all over the world, you will now see that probes from various countries are automatically created and TCP Checks are done to 1.1.1.1 (whatever IP you used) where the number of ms connect time is now visible.
In my case i also added the region's as tags to the dummy hosts, i wont deep dive in to that now but if you do that you can create a very nice dashboard with almost real time data like:
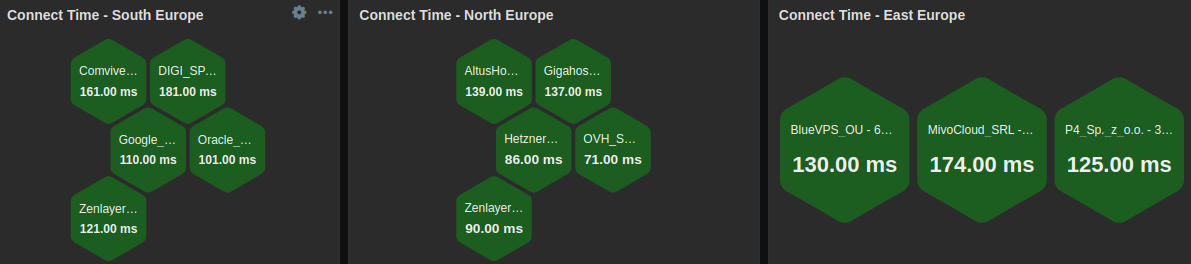
With this data alone I already know whether the accessibility of the application is stable from multiple regions, fast enough or whether a timeout occurs.
Now the real magic
Remember i added a second item with MTR that we didnd't use yet? I use this in a different way, to gain insight into possible issues much faster. Here is why;
The probes simply measure TCP connection to the port, they don't give any more information (except connect-time). I think it's important to know why the latency goes up and whether that's related to our server(s) or something else. For example, I had a recent trigger where multiple probes in North America showed increased latency but this was due to an incident at a Tier-1 carrier. Saves a lot of searching if you can get this directly from Zabbix! Let's make that happen
Still on the Globalping HostTemplate create a new discovery rule with the following:
Name: {#ASN} {#CITY} MTR
Type: Dependent
Master Item: ICMP {$ASN} - {$CITY}
Key: mtr[{#ASN}]
# IMPORTANT:
Delete lost resources: 1d
Disable lost resources: Never
This links to the previously created item (which exectures the MTR) and we can parse the Json with the folling parameter:
$.results[0].result.hopsAll we need from this are two LLD Macro's:
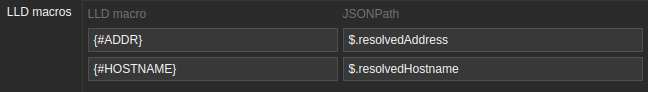
And add a filter to check if #ADDR does not match 'null'. Now let's create an item that simply gives back the latency:
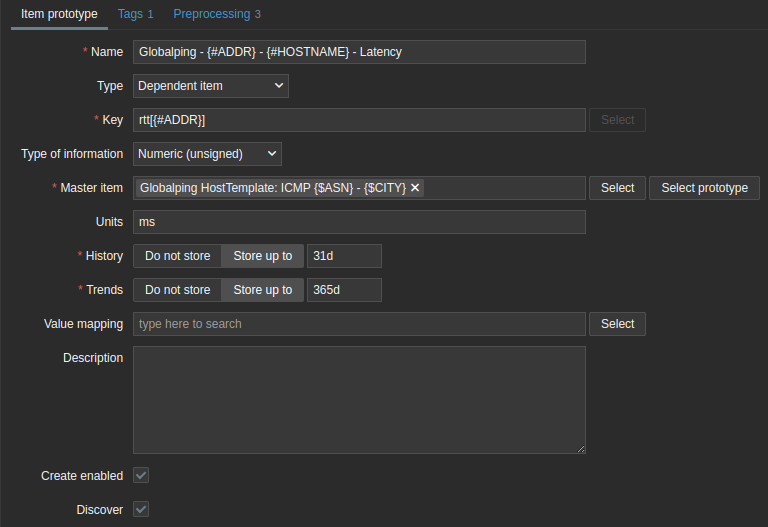
We can get that information from the previously created Master item and then lookup the latest value:
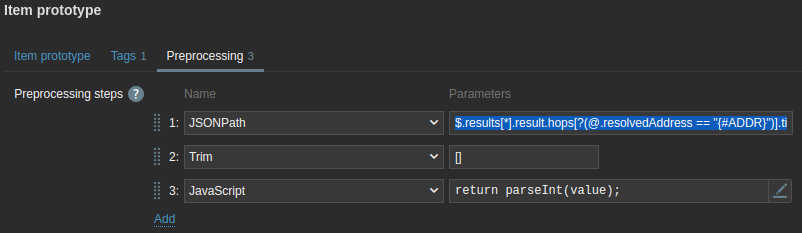
$.results[*].result.hops[?(@.resolvedAddress == "{#ADDR}")].timings[0].rttHere is the complete Preprocessing step:
Curious what this looks like? Go to the latest data from one of the dummy hosts and you will see all hops of the MTR including the latency:
And we can now check that information from any probe we want:
We now have the combination of our HTTPS Connect time to the server, together with the network path between the probe and the server including the latency. If we now get a message of an increased HTTPS time, we can see based on the path whether there is another malfunction going on. You can also add more statistics like dropped packets and such with the following Jsonpath:
# Dropped packets:
$.results[*].result.hops[?(@.resolvedAddress == "{#ADDR}")].stats.drop

# Loss percentage of the hop
$.results[*].result.hops[?(@.resolvedAddress == "{#ADDR}")].stats.loss

# Total packets sent to the hop:
$.results[*].result.hops[?(@.resolvedAddress == "{#ADDR}")].stats.total
Visualization
Because we have the location of the probe we can make a very nice image of the probes and (by means of triggers) immediately see where a problem has arisen: